Tuesday, June 27, 2006

Gold 589 4am est.

Here's a 4 hour bar with 50 and 25 bbands MA AND TRENDLINES. Pivots are suggesting 603 608 as does horizontal resistance. We have been day trading GG very well and pivots are working well on it too.

Friday, June 23, 2006

Thurs Gold 582

4 hour bar and 1 hour bar with Trendlines and BBands 50 ma
If we can keep this uptrend and Gold/Miners can break away from it's lock step with the Dow we may have a move, Caution is still the word,

Nice ABC day trade in GG today. A 26.84 B 27.34 C 27.21 Pivot at 27.46 Target Reached 27.71 plus, +.25 of the potential .80, a little too quik on the sell button.


Thursday, June 22, 2006

Wed. Evening Gold 591 breaks up

One chart tonight, I believe this says it all... Gold breaks up throught the down trend line and now climbing up the 50 unit Bol Band. I will look to add again as we play with the 50 unit moving average.

Here's a good post to read...
http://www.siliconinvestor.com/readmsg.aspx?msgid=22559911

Wednesday, June 21, 2006

Tues Eve Asia trade Gold 577.70

This evenings Gold Charts - 2 hour bar trendline study
4 hour bar trendline

Daily Bar - Look how symentrical the trend lines shoot from the lows. A horizontal bar at 545 Current price line at 577, A nice Lars chart will show up on jsmineset.com tomorrow.

I am going to do some select buying over the next few days to diversify a bit.

Monday, June 19, 2006

Sunday Asia Trade Gold 570


Happy Father's Day, I started this blog on Mother's day with gold in the 700's, I would bet that next year at this time we may be going through a similar correction except from much higher prices.

Here's a cut from last Dec. and recent action in gold charts. These charts seem to trace a similar pattern

I think the next move will be one order of magnitude greater.

Next update tomorrow evening or as time permits.

Friday, June 16, 2006

Fri AM Open Gold 574.8

Here are a couple of long term charts, the SharpChart was sent to me by Charles. I had not done a long term study in quite a while.

The second chart is a Daily bar and illustrates how the trend lines are watched so closely. When the middle trend line broke all heck let loose and down we went, also POG tagged the 200 day moving average.

As to the current action, use this
http://www.netdania.com/ChartApplet.asp?symbol=XAUUSDOZ|comstock_lite

We are still fighting the down trending short term 1 hr and 2 hr bar charts. You can create the same charts on your own using the tools, likes, setting etc at the above link.

I use screenprint 32 to capture my set ups for posting here. Feel free to send in your observations and I'll post them.

Rick is cautious and portends another down move in gold where a buy set up would occure.
Chan is still short but his indicators and signals lag. Looking for an article by Hoye.

Thursday, June 15, 2006

Thurs AM Gold 569


I'm going to call a Gold bottom here as I have suggested buying this drop. I see many island reversals on stocks and am waiting for Gold to have it's gap up. Here's the daily chart with trendlines and the 200 day moving average. Hoye had it exactly right, it is interesting how a study of history yields such accurate behavior in the markts. you can find Hoye at Safehaven.com
Enjoy the Gold bull... now giddy up.

Say to my reader in Eagle River, if you'd like to visit sometime give me send me a note centuryadvisors2000 @ yahoo.com

Wednesday, June 14, 2006

Tues AM Asia - The aftermath of destruction

Here's a Daily chart where gold tagged trendline support just about perfectly overnight. Below is a closup as of about 4am NY time.

I hope you did not give your shares or gold away yesterday. I expect a substantial rally to form and my guess (and hope) is for an island reversal to the upside.

Good luck and be carefull. Buy this fire sale
.

Tuesday, June 13, 2006

Monday Drubbing #2 GOLD 594


Last Monday had the same title. Here are this evenings charts.
The above trendline studies look compelling but MOMO rules. I noticed low volumes on the miners these days. Lots of bears out there and lots of whining. I think everyone is waiting for the rally that won't materilize. All markets in free fall.

Monday, June 12, 2006

Sunday - Asia Trade Gold 605.30 evening update


Downtrends intact short and intermediate term on the 2 hour chart with trendlines while on the 10 min chart after a test of 601, it looks like we are trying to base. Further downside looks likely but it won't take much to bust those down trending lines and move up.


Saturday, June 10, 2006

Weekend Update Gold 608.2


Gold Xau ratio, MNG, nice up trend, AUY 2x bottom, NXG 2x bottom with the 2nd on lower volume

Friday, June 09, 2006

Friday AM Gold potential target reached overnight

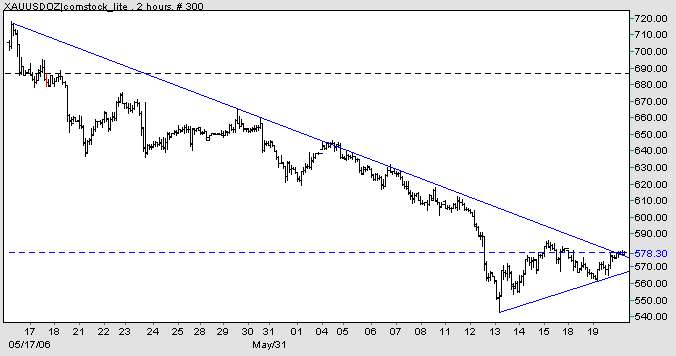
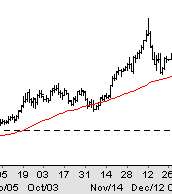
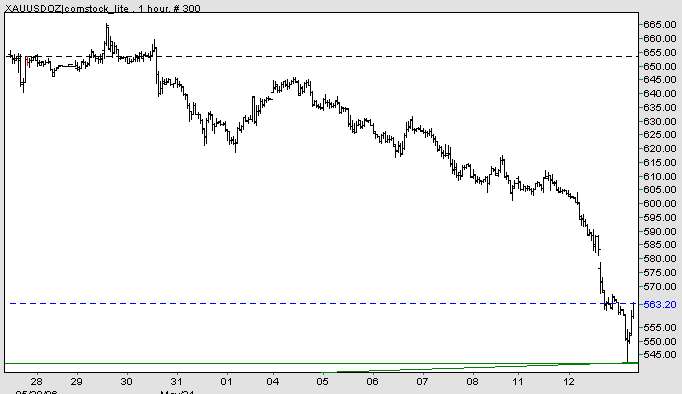
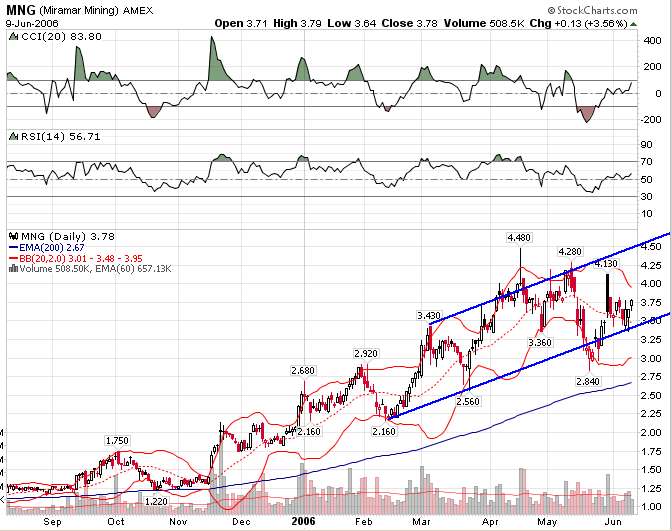
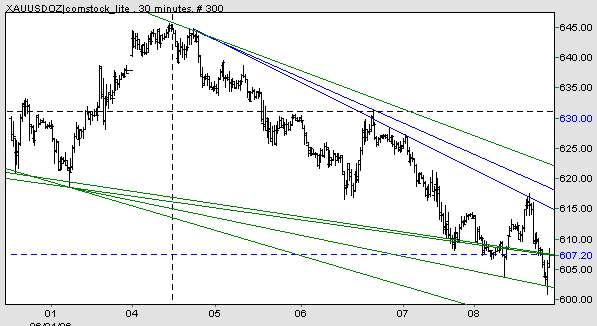
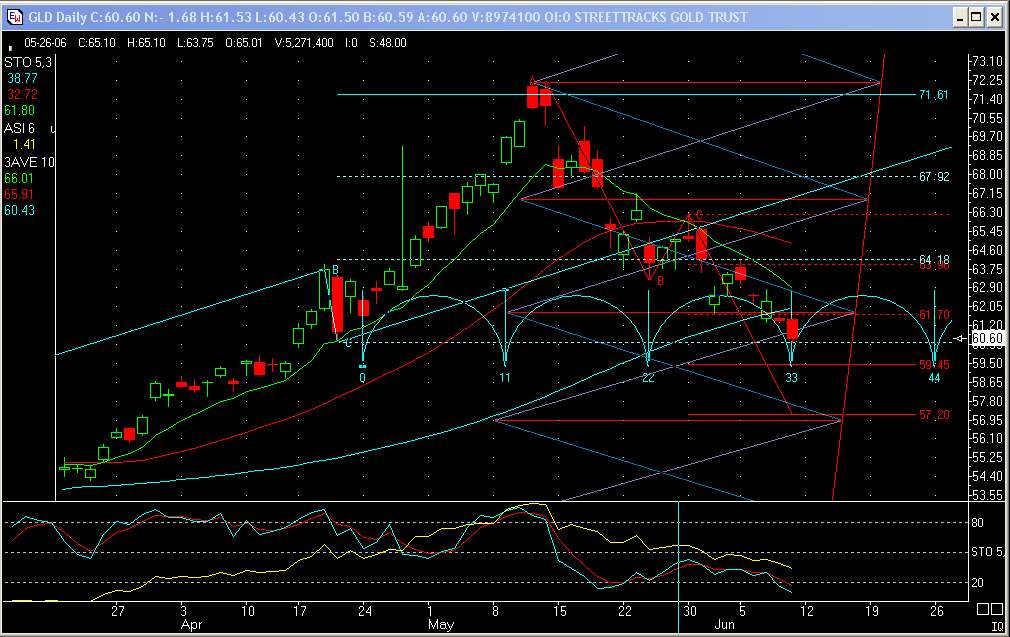
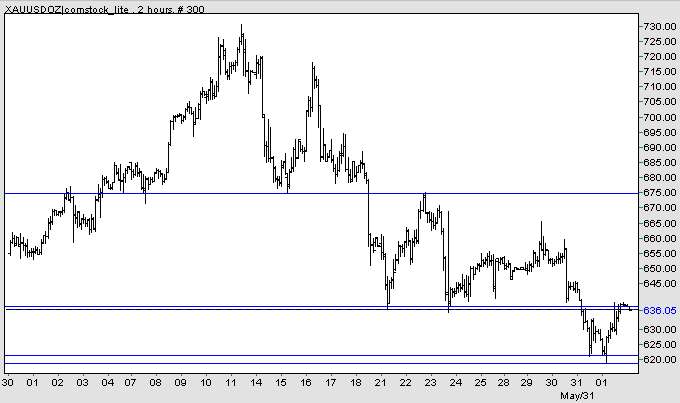
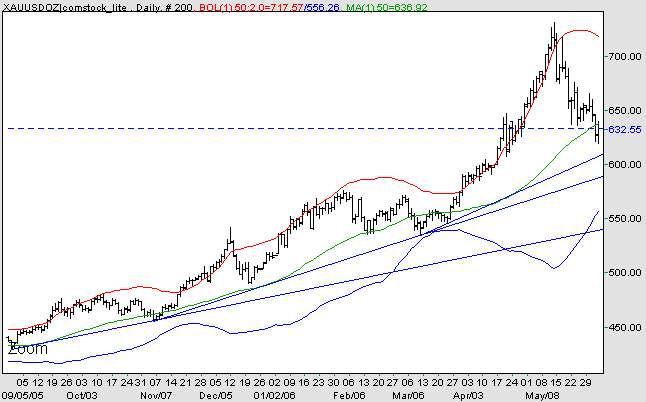
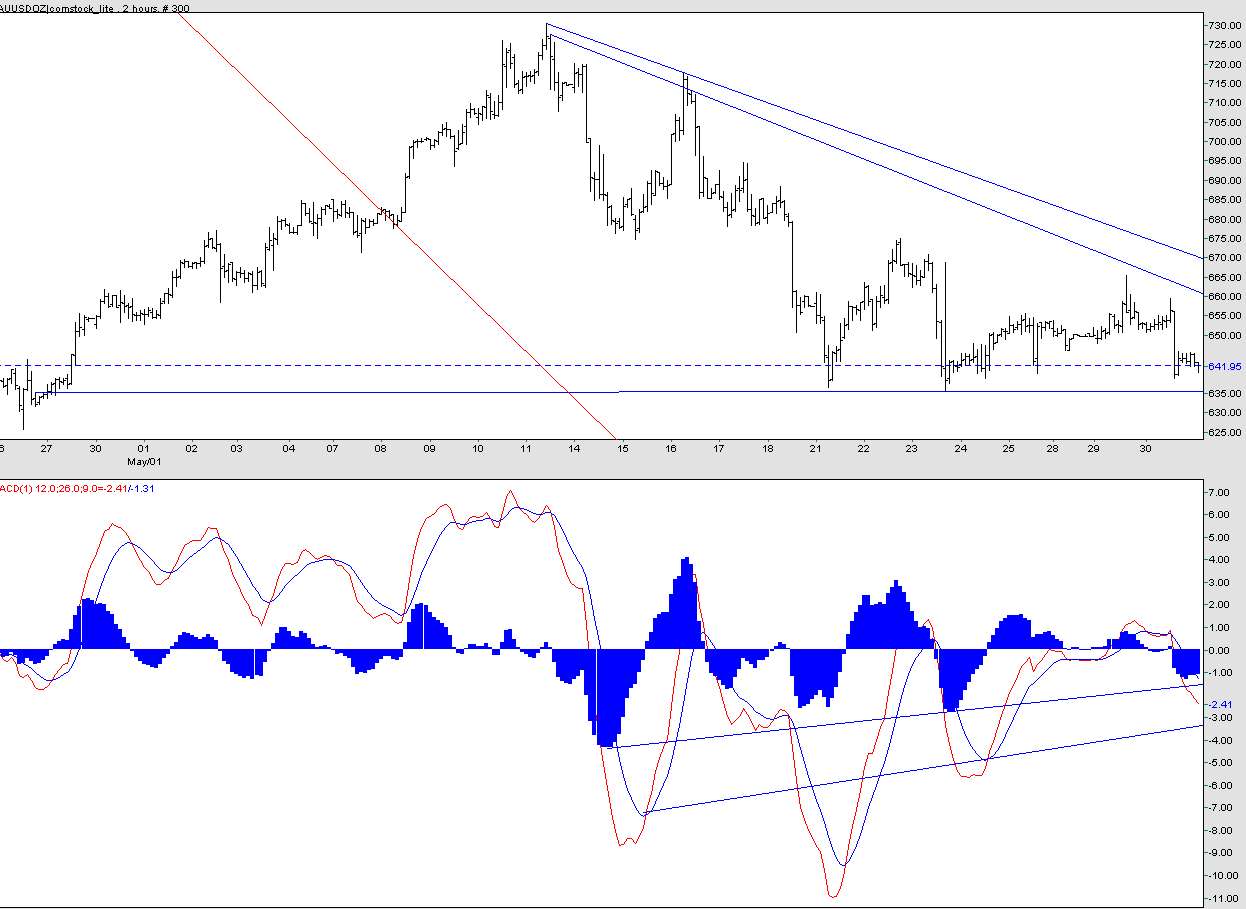
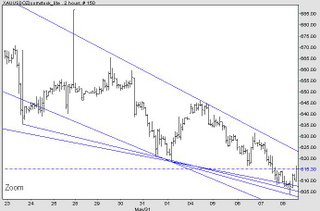
Friday Close chart to the left.
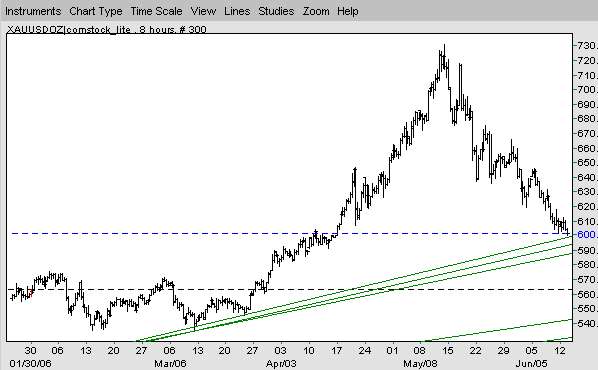
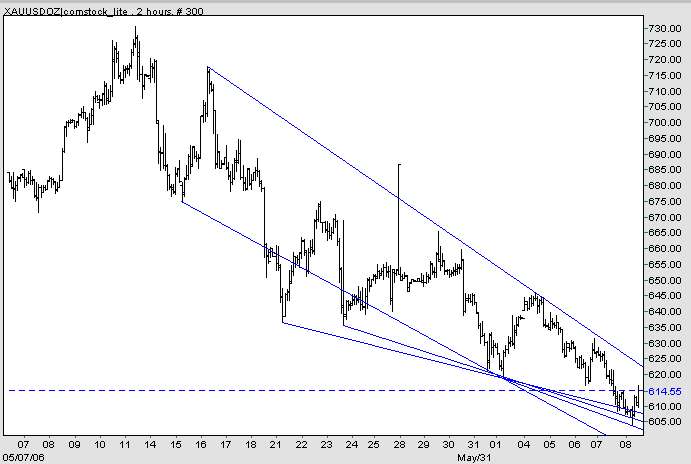
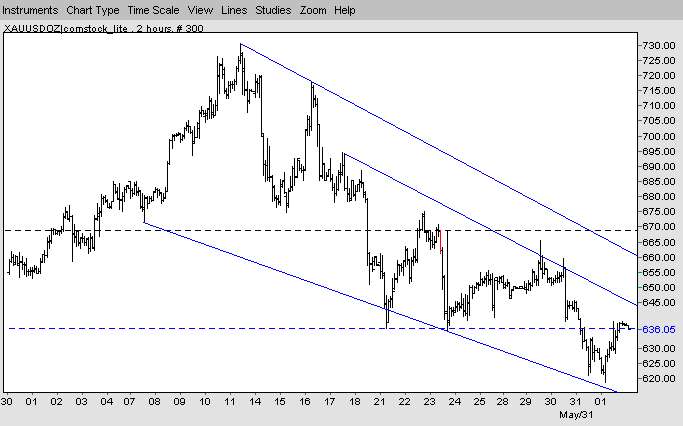
The trend lines are pulled from various hi/low ponts above and below. I find the compression of this chart compelling to suggest accumulation.
I believe this chart will resolve up.

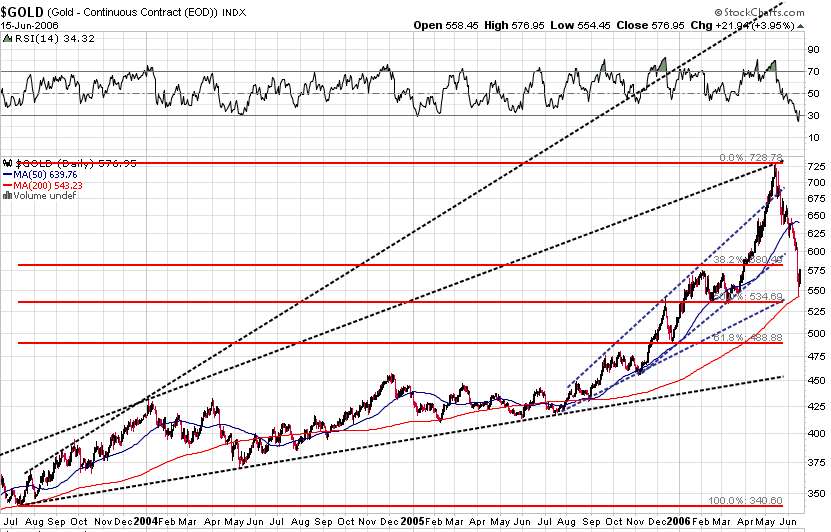
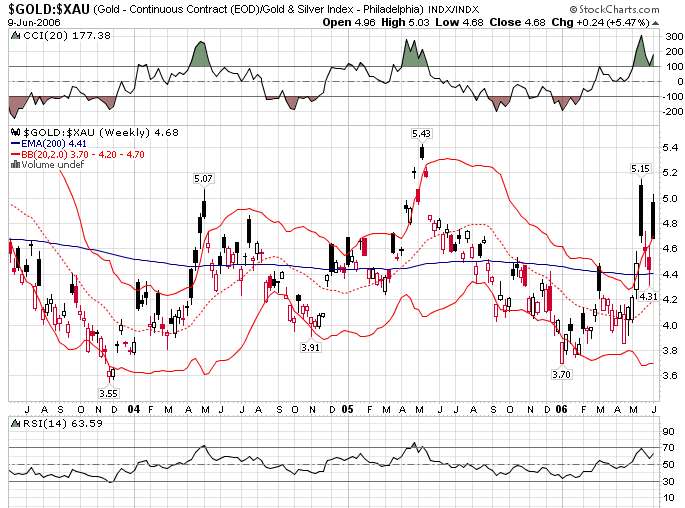
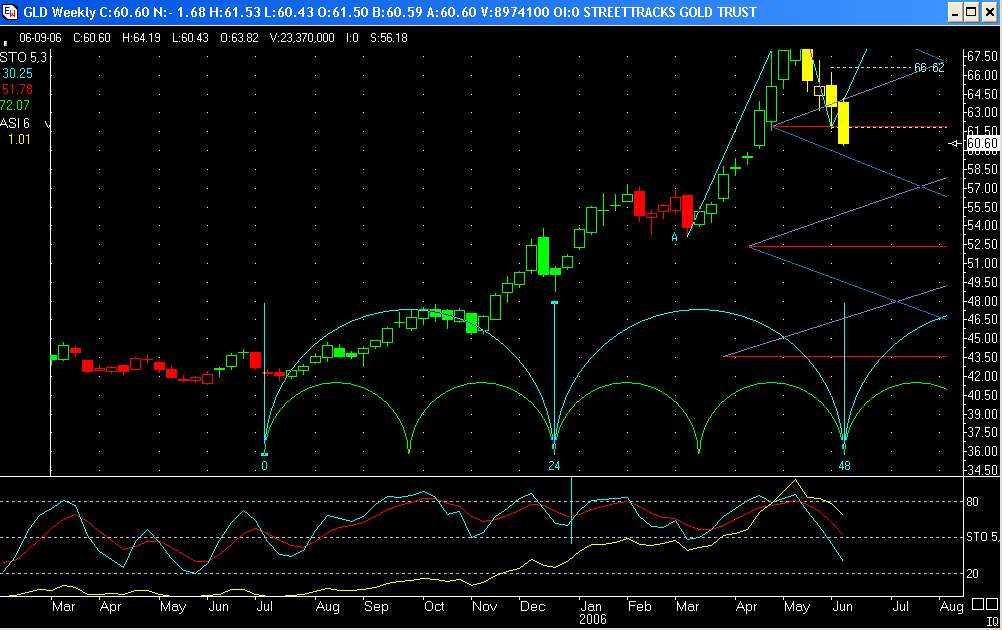
It's been interesting watching the cash gold action closely and calculating pivots on the short term moves. Trend lines are matching up with Pivot calculations.

My low Target was 603.1 which was breached down to 600.65 for only a few minutes.
One could conclude we go lower bc the Target was breached. The 603 target was projected on a 8hr bar begining with A = 644.5 B = 616.4 C = 625.55, we shall see if it holds. Rick has 599 basis August and I bet that was hit today.

A second Target area 604.1 was projected from 615 / 608 / 610 ABC

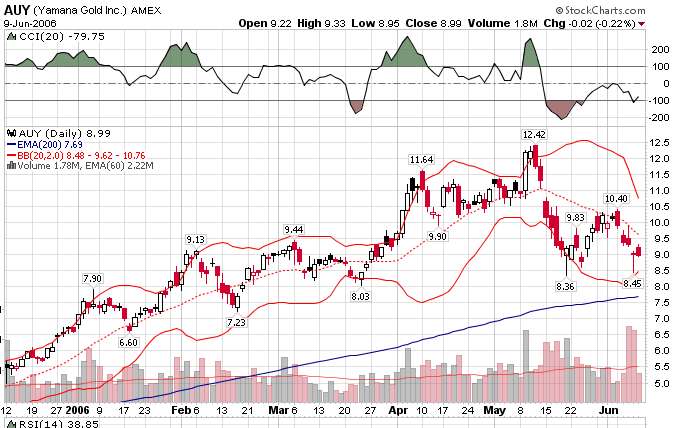
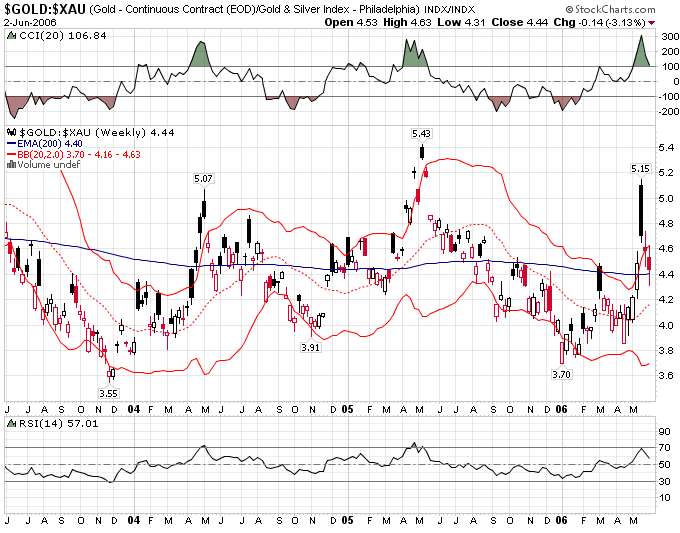
The stocks were reluctant to follow the POG down. I'll post a few more observations later.

Please let me know any comments or input on this work, have a good weekend.


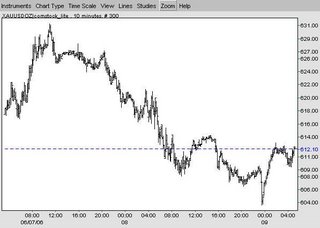
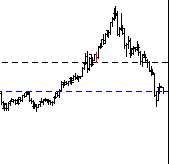
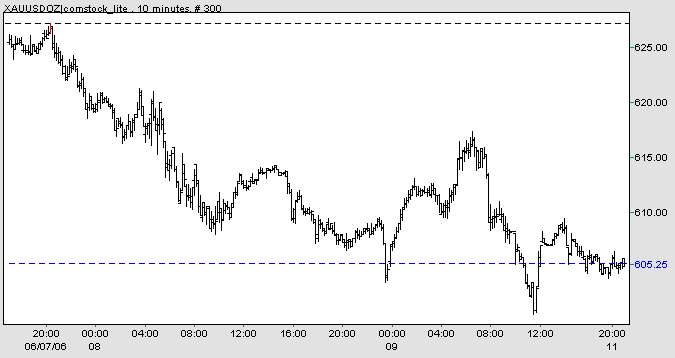
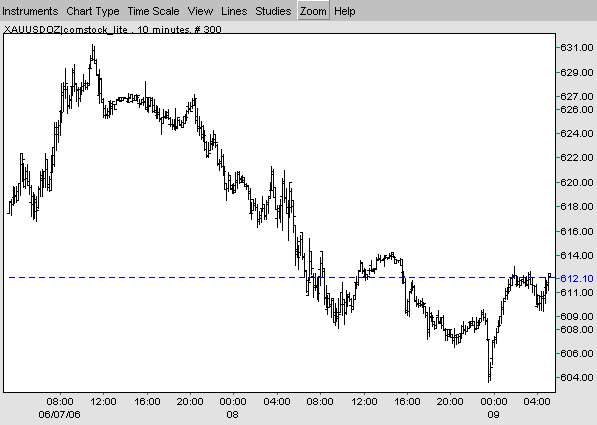
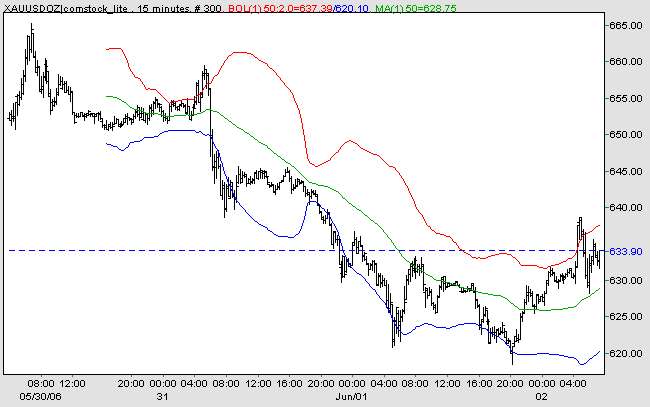
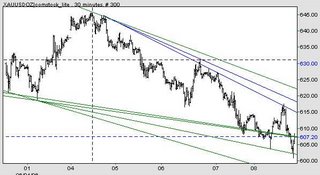
Here's a look at a 10 min bar, illustrating the potential bottom ST. I have been buying the last few days as this market could turn on a dime and I don't want to miss a dime... Perhaps the wrong strategy, but I don't mind the risk nor trying to pick the exact bottom.

My pivot low target of 603.1 vs an actual 603.55 on this chart, a difference of 45cents I will consider the target as held for now.

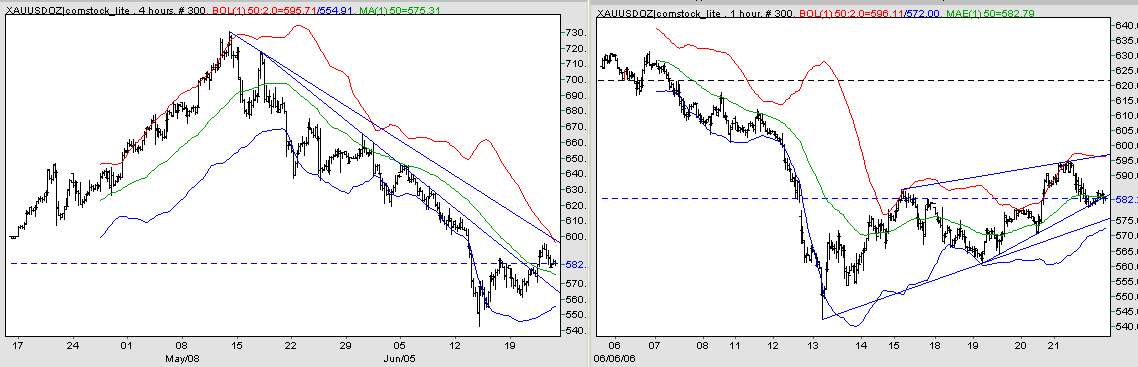
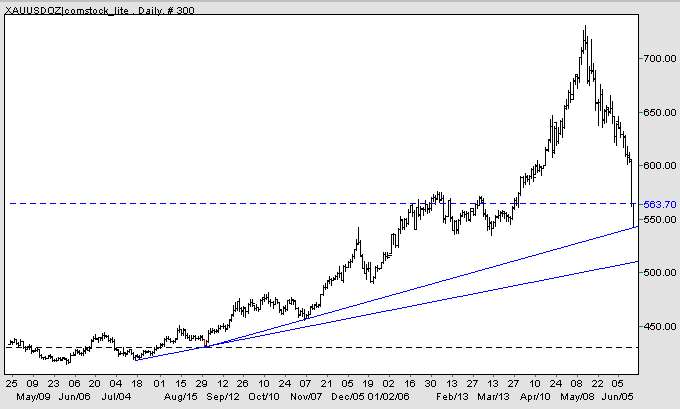
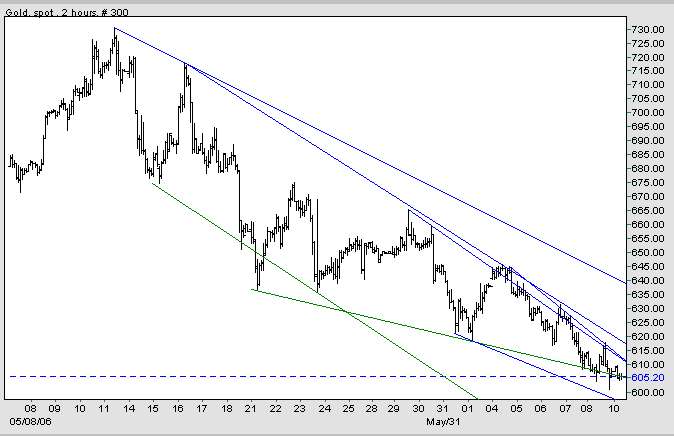
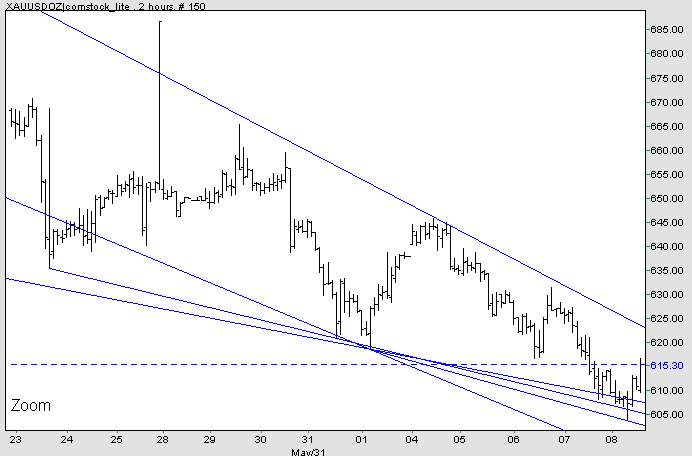
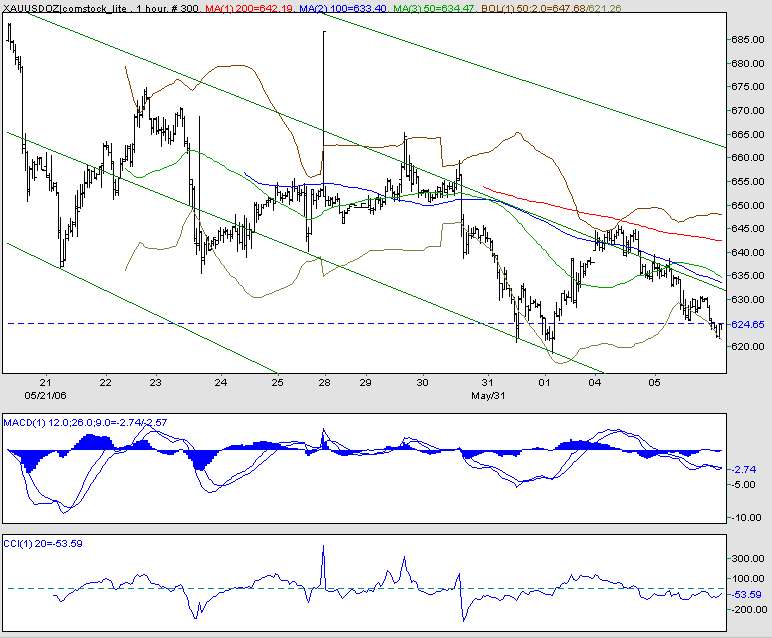
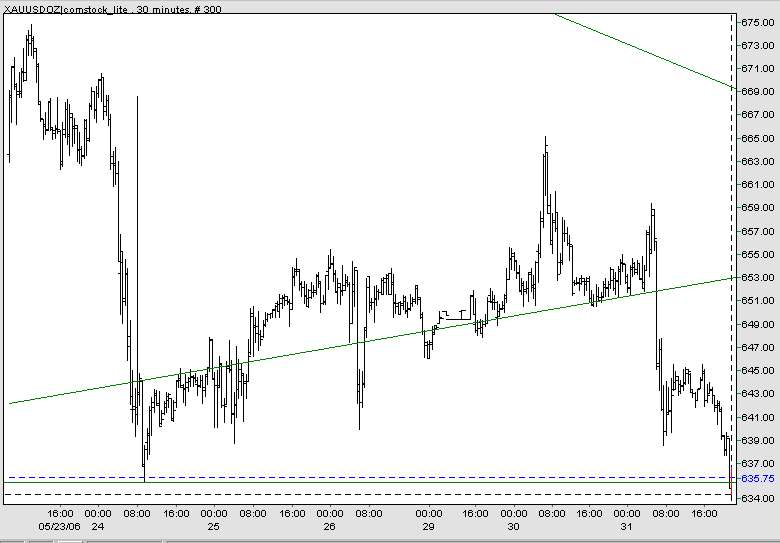
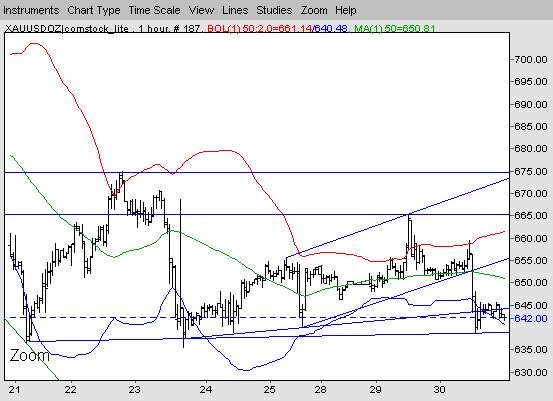
After the open, some trend line studies, 2nd chart is zoomed in.
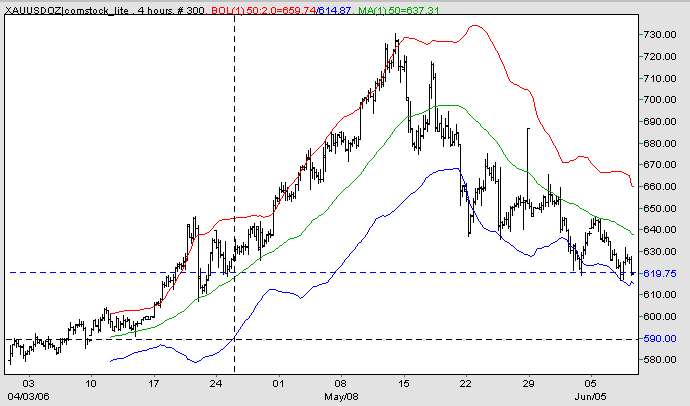
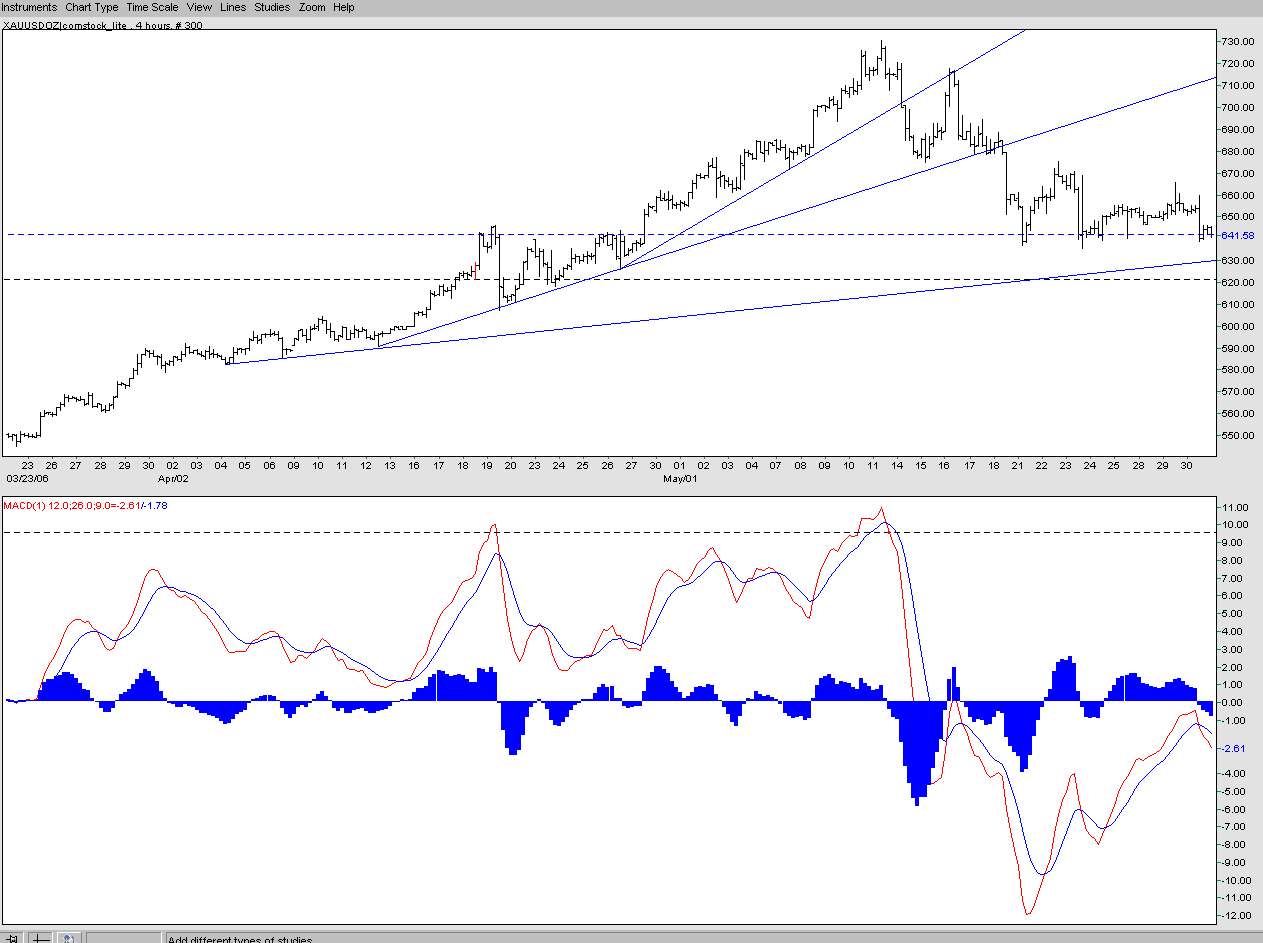
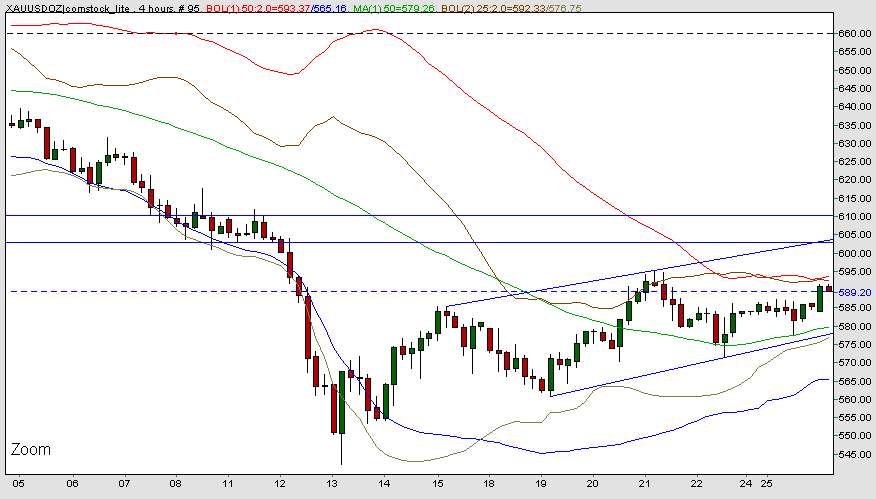
Thursday, June 08, 2006

Thurs NY Close Gold 613

Here's a look at a cycle study on GLD from Hunter.

Also illustrating the down wedge.

Watch for old faithful...


Wed Evening Volatility Increasing

Here's a 4 hr bar chart with 60 unit BBands. I think we are closer to a bottom than a top, as does Grandich, Jim Sink. I was pounding the table in the chat room this morning .5 hr into the day.

Portfolio down a tad but was up nicel intra day.

Gold still tracking down the trend line, the chart reminds me of tax selling candidates in December.

Still bullish... lot of good articles out today with very different opinions.

Wednesday, June 07, 2006

Tues Evening Gold 623.90 in Asia

Here's a 1 hr bar of gold snap shot at about 2am Eastern time. After scanning the stock charts this evening it is not looking good for the miners. Some are still trending up and staying above the 200 ma, others have rallyed to the 20 dayma and got rejected. The sellers appear to be in control but ol' Jimmy Sinclair says don't panic.

Thanks to those of you who have IM'd me, we have had some nice conversations and I look forward to meeting one who is visiting Alaska later this summer. I'm always impressed with the knowledge and experience of other traders.

That said, I took the plunge and bot some PAAS shares, and set up a short put long call on GG for a small credit. We shall see how it plays out, if we turn up here quickly I'll be a happy camper, if not I buy later in July.

Chan is out, Hoye I suspect is nibbling in here, Rick says pivots down to 600, My pivots studies are as follows...

On the up side the long term big up starting at 544.55 730.2 618.35 (ABC) yields an Entry of 643.91 (near Rick's 644 which would negate the 600 target) Pivot of 711 and Target of 804.

On the down side near term I have 580 whilst we flirt with the midway pivot of 622.72. I think we hold and move up. even if it's a counter trend rally for more down?

Tuesday, June 06, 2006

Monday Drubbing

I have some nice charts to post but the site is having troubles letting me post them. Briefly, the downtrend line appears to be preventing any real rally in the price of gold on a short term basis. The 8hr and Daily bar charts have some support at the 50 unit MA. CCI over sold, MACD way down. PF decliened 3% for the day, my RGLD Short Put Long Call pay was profitable in the morning but now slightly negative.

I have to remind myself one of R. Russel's "important lesson" the most important thing you can do in the markest is take action. There is a big difference between thinking and acting.

More later, when the charts can be posted.
Thanks for visiting,

Sunday, June 04, 2006

Weekend Update Gold 636.80


It is interesting to see how sensitive the price of gold is to what I will call "touch points". Friday's close of 636.80 is within pennys of the two touch point lows made last week. Another touch point area above lies a 674.50 - .80. For now 618.35 could be the next touch point for a continued move downward or a test and rally.


Trend line study indicates further down...


Clive, looking for a rally and then more down on the price of gold while the HUI looks promising.
http://www.safehaven.com/article-5297.htm


Finally, this Ratio chart illustrates this years buying opportunity.

Trades, this week: bot GSS 3.09, holding others have 45% cash.

Have a great weekend and thanks for looking.
JC

Friday, June 02, 2006

Friday Gold reverses in Asia overnight

Gold appears to have bottomed last night. Hidden Pivots studies showed that when we "fell off the table" (post below) the downtrend traced out a small ABC down where A=645.1 B=629.6 C=636.5 for a Target of 621, Actual Low was 620.60. Has the trend changed?

On the upside the pivots from the low of 618.35 produced a target of 636.65 whas has been surpassed however appears to be showing some resistance. Further the larger pattern on this chart also projects a target of 648.15. Perhaps next week.

Below is a daily chart of Gold for reference.


Well I wish I had not sold out of my AUY positions yesterday.... We all get shakey fingers huh...
Legging back in today. BOT some GSS this am. Lots of cash and good gains in accounts, though yesterday went from 1.92 to 1.85. Most of my movement comes from NXG and EZM where I have large positions. along with GPXM PMU

Thursday, June 01, 2006

Trades & Observation

Sold AUY and GG for nice gains 50% cash overall, I thought the tape looked good this AM Look to reenter GG below 29, RGLD put call positions in good shape. more later

Gold update 2am Eastern Edited 9am est.


Here's the battle in the middle of the night whilst you sleep.
The magic # is 635.25 the lows on the 24th for horizontal support, for short term?

Edit: 624.65 now in play, Larger downside Pivot Targets 582.85 but not sure about that one.
Edit: get your parachute.

Like I said in the previous post, could fall off the table, or hold...
In any event a quick Pivot study on the 30 minute chart gives a target of 624,24 but 635.05 is the pivot that must be broken, lets say 2 hourly closes below there may do it.

My guess is the magic pivot of 635.05 will hold within pennys. At least that is my hope...
Edit: (See what happens when you hope) ...and all this is over before you wake up... and gold heading on up. I think I am too early but we'll see what the stocks do tomorrow.

Btw, heres the latest traffic count.

Evening Update Gold 638.20 Wed 12:30 am Eastern


Looks like gold could fall of the table if it breaks 636 or so. I think a dip will be shortlived as there are buyers waiting underneath. In any event miners are coming off of over sold levels. Many I chat with are selling, I am holding, lucky I bot right. In any event, even though POG is looking slow and sideways, I've been fortunate to have growth from 1.75 to 1.92 since last Wednesday.


Trade entry today was to Sell some June RGLD 30 puts and go long October 35 Calls. Net -100.
I expect the Calls to expire worthless in June, and I will own the calls for .20 each. Otherwise I buy 300 shares of RGLD at 27.50. My put sell price was 2.65.

Some current charts for your perusal.