Fri AM Open Gold 574.8
 Here are a couple of long term charts, the SharpChart was sent to me by Charles. I had not done a long term study in quite a while.
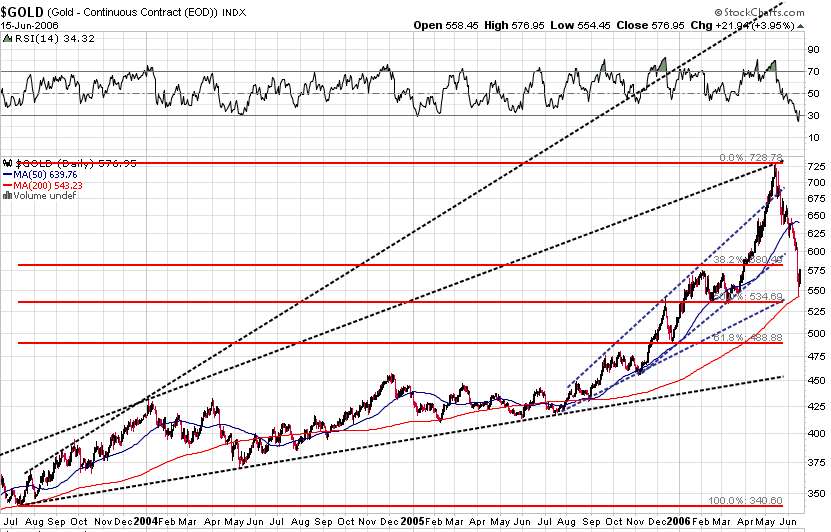
The second chart is a Daily bar and illustrates how the trend lines are watched so closely. When the middle trend line broke all heck let loose and down we went, also POG tagged the 200 day moving average.
As to the current action, use this
http://www.netdania.com/ChartApplet.asp?symbol=XAUUSDOZ|comstock_lite
 We are still fighting the down trending short term 1 hr and 2 hr bar charts. You can create the same charts on your own using the tools, likes, setting etc at the above link.
 I use screenprint 32 to capture my set ups for posting here. Feel free to send in your observations and I'll post them.
Rick is cautious and portends another down move in gold where a buy set up would occure.
Chan is still short but his indicators and signals lag. Looking for an article by Hoye.
posted by Jim at 6/16/2006 09:29:00 AM
![]()
![]()

0 Comments:
Post a Comment
<< Home