Sunday, July 30, 2006

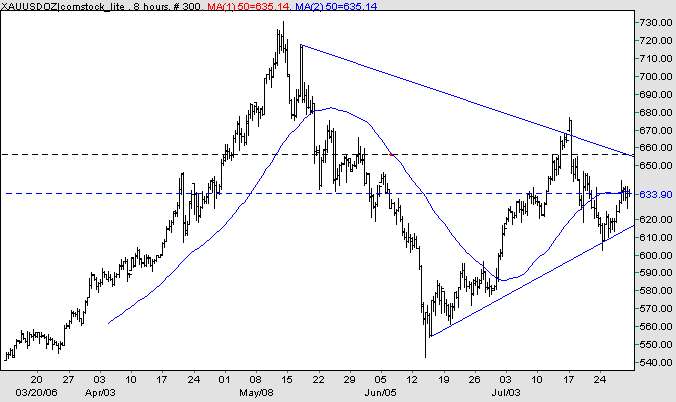
Weekend update Gold 635.30

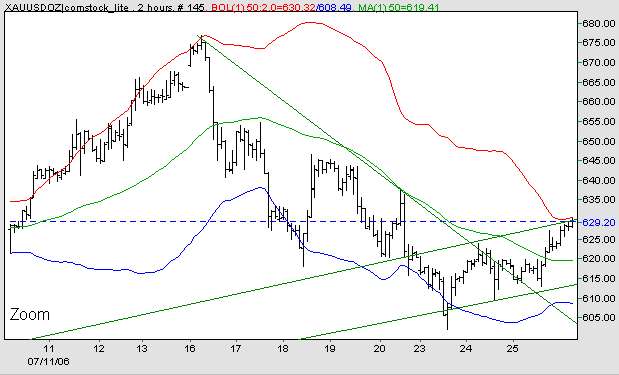
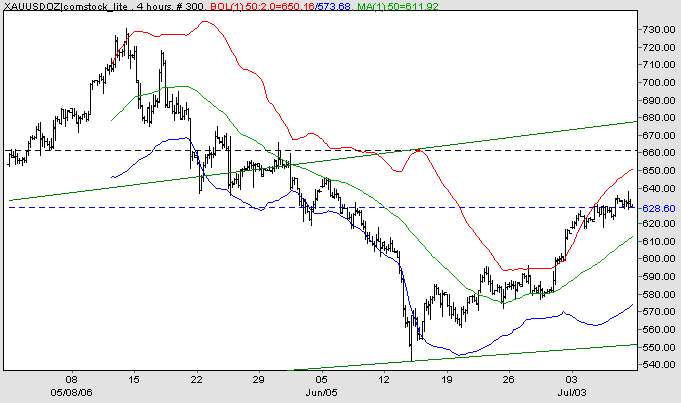
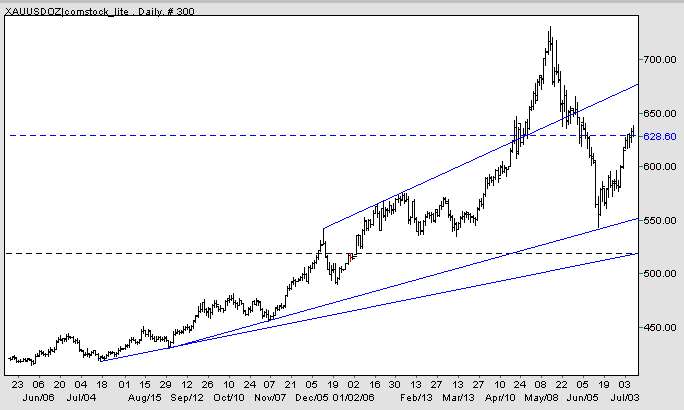
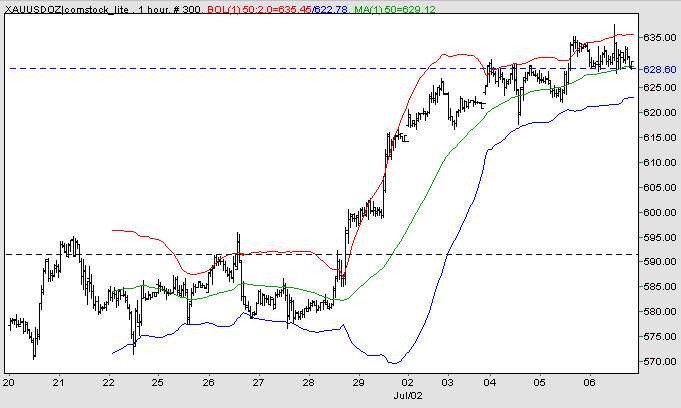
Gold has several hidden pivots in the 636 area where we sit right now and price is having trouble moving through this conjestion area. On the 8 hour bar there's resistance at the 50 unit MA. Longer term hidden pivots project a move back to 724.5 or on the down side to 566.5
Shorter term the move from 601.8 projects an ABC pivot to 634.75 which is why we are having trouble moving up through here. I tend to give a bit of room and work with ranges rather than to the penny like Rick. Charts basis www.netdania.com cash gold.

For now I am hedged a bit with some calls sold short against positions. I think the likes of PAAS, GG and other move down next week and into options expiration in mid August. I may be early as is usually the case. I will be out for a couple of weeks on vacation but will try to update once or twice a week.


Thursday, July 27, 2006

Gold 628 Weekly update


A couple of standby charts, 4 hour and 2 hour bars with the 50 bbands. The ABC off of the low projects to 636.4 where there are other hidden pivots from the up move and down move of recent months. Other pivots of lesser degree are at 638 and 642.3 my best guess for now.

Wednesday, July 19, 2006

Gold 626 quite a drubbing but...

Here are a couple of charts illustrating the correction, or better put, "take down" of Gold. The first chart shows the trendline study and the second adds the BBands 50 unit with 50 unit on a 4 hour bar chart.

My hidden pivot study on this move projects to 619.75 which I predict will mark the bottom of this ABC. As the Gold pundits say we are in the big 3rd wave or the 2nd phase. Gold will not go straight up and we won't see recent lows imo.
My guess is this correction sets us up for new highs. An additional reason 619 is important is a longer term hidden pivot target exists from a older long term ABC starting at 489.70=A 574.93=B 533.8=C Target 619.03

Rick, www.rickackerman.com has the 623 area targeted basis August Gold Futures. I guess I have some bragging rights as my up target from 642 (post below) was .40 cents above the actual high of 576.50.
These Gold charts and price projections are based on www.netdania.com gold feed.

Enjoy, but time is near... when uncertanty is greatest.


Gold 626 quite a drubbing but...

Here are a couple of charts illustrating the correction, or better put, "take down" of Gold. The first chart shows the trendline study and the second adds the BBands 50 unit with 50 unit on a 4 hour bar chart.

My hidden pivot study on this move projects to 619.75 which I predict will mark the bottom of this ABC. As the Gold pundits say we are in the big 3rd wave or the 2nd phase. Rick, www.rickackerman.com has the 623 area targeted basis August Gold Futures. I guess I have some bragging rights as my up target from 642 (post below) was .40 cents above the actual high of 576.50.
These Gold charts and price projections are based on www.netdania.com gold feed.

Enjoy, but time is near... when uncertanty is greatest.


Wednesday, July 12, 2006

Gold 642 safe up move to 677 in play


Well, not so safe, but that is a good thing, how often do you question your decisions or suppositions on the markets? I for one am the best indicator as whence I should be buying, I have in the past sold. Once you can read and act on the opposite of your emotions you will be rich, how profound.

As for today's gold market, its 5 am eastern and we are trading above 640, how far that seemed away $100 bucks below. How scared were you, did you hold, did you buy?

Here's one of my favorite reads on Gold, please note my pivot calculation below. 677 is a done deal for now.

Tuesday, July 11, 2006

Hidden Pivots on Gold

Gold Pivots, If A starts on the 28th at 580.45 and B is 637.45 with yesterdays dip the BC leg C at 619.8 then We have Entry at 634.15 Pivot 648.4 and T of 676.9. this is basis cash gold ref netdania.com

Interestingly enough the 677 area corresponds closely with the trendline posted below.

Thursday, July 06, 2006

Gold 632 weekend update

First my apologies for the long delay since my last posting. I realized many of you are checking this blog quite frequently. We have been trading GG almost daily and JT has been really doing a good job of it. Here are a Daily, 4hour and 1 hour bar chart of gold. The daily looks like it needs a rest and to form a BC corrective leg. The 4 hour looks like we could test the 50unit MA or blast up to 650 just as easily. The 1 hour bbands have narrowed which is good for a potential move up. I have held all my positions other than my GG options and GG stock. enjoy.