Site Moved
This site has moved to
http://goldenpivots.blogspot.com
posted by Jim at 5/03/2007 08:37:00 AM
|
0 comments
![]()
![]()
Welcome. Note: Times posted here are now Eastern time.
This site has moved to
posted by Jim at 5/03/2007 08:37:00 AM
|
0 comments
![]()
![]()
Posted after Asia opening, 10:30 pm EST
posted by Jim at 1/01/2007 10:08:00 PM
|
0 comments
![]()
![]()
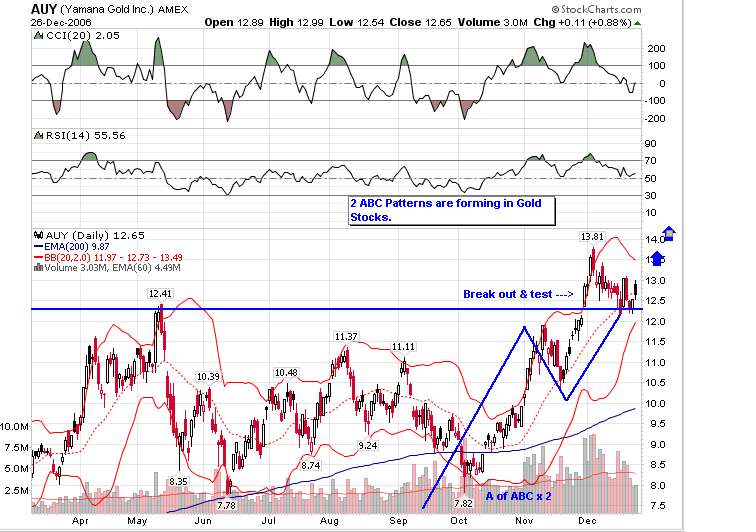
Here are AUY and GG... Hidden pivots on these ABC patterns are waaaay up there...

posted by Jim at 12/27/2006 09:43:00 AM
|
0 comments
![]()
![]()
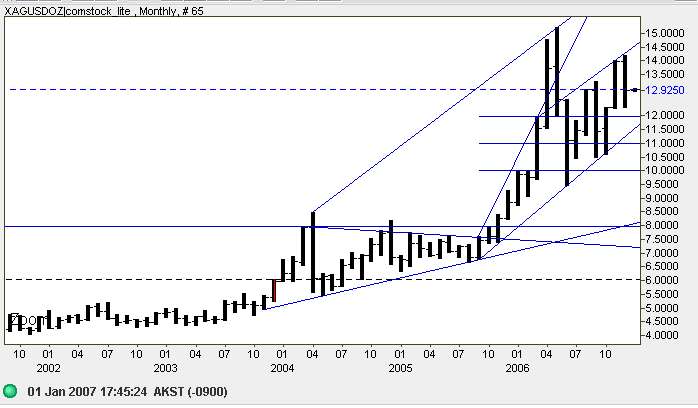
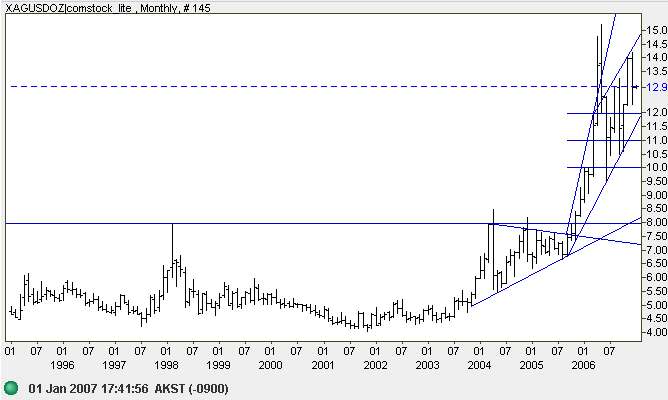
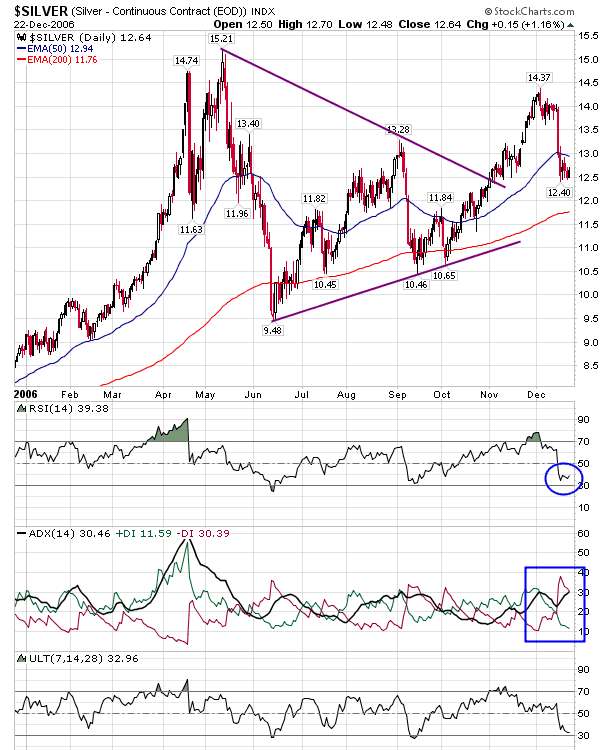
Here are a set of silver charts for your perusal. A stock charts from Jimsioi at the bottom of the list.
 Silver Weekly with the same trendlines applied
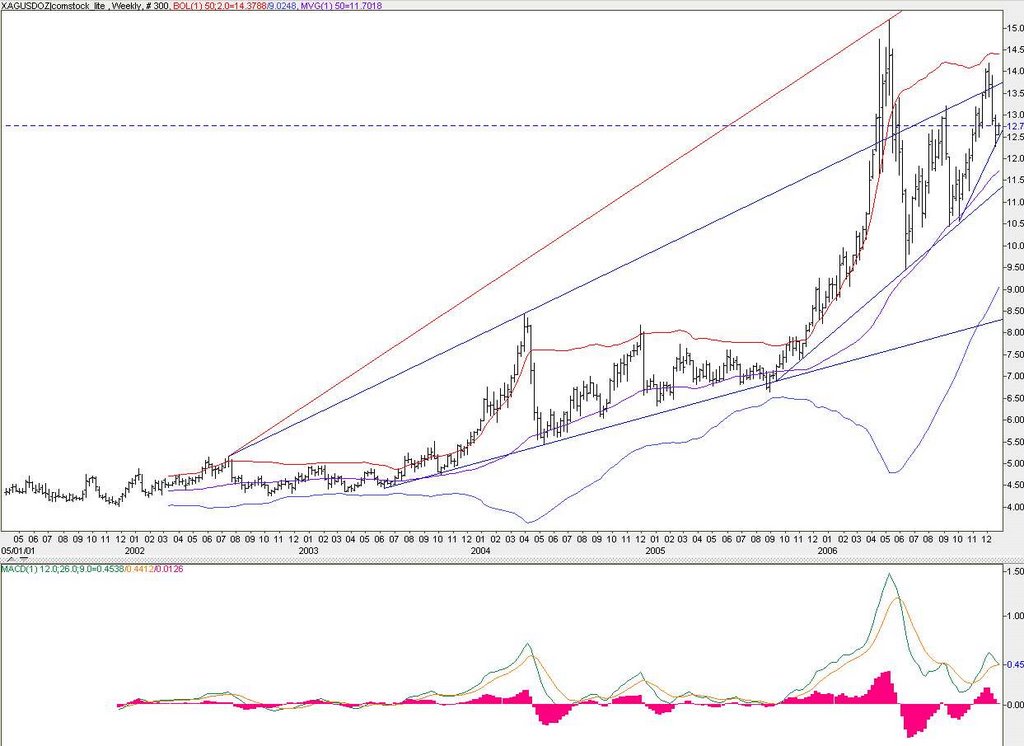 NICE touch on the trend line.
posted by Jim at 12/26/2006 12:41:00 AM
|
0 comments
![]()
![]()
posted by Jim at 12/21/2006 06:06:00 AM
|
0 comments
![]()
![]()
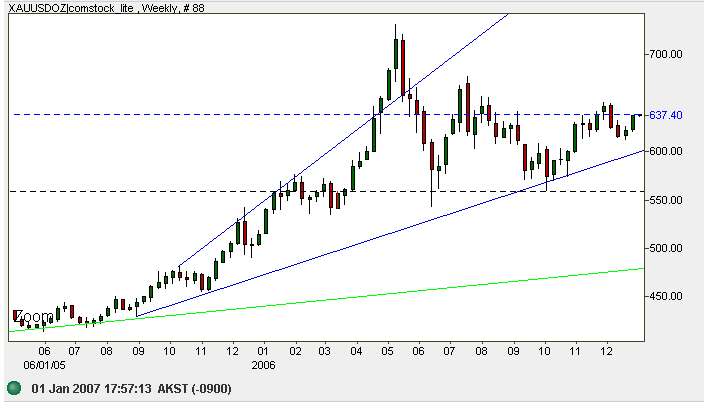
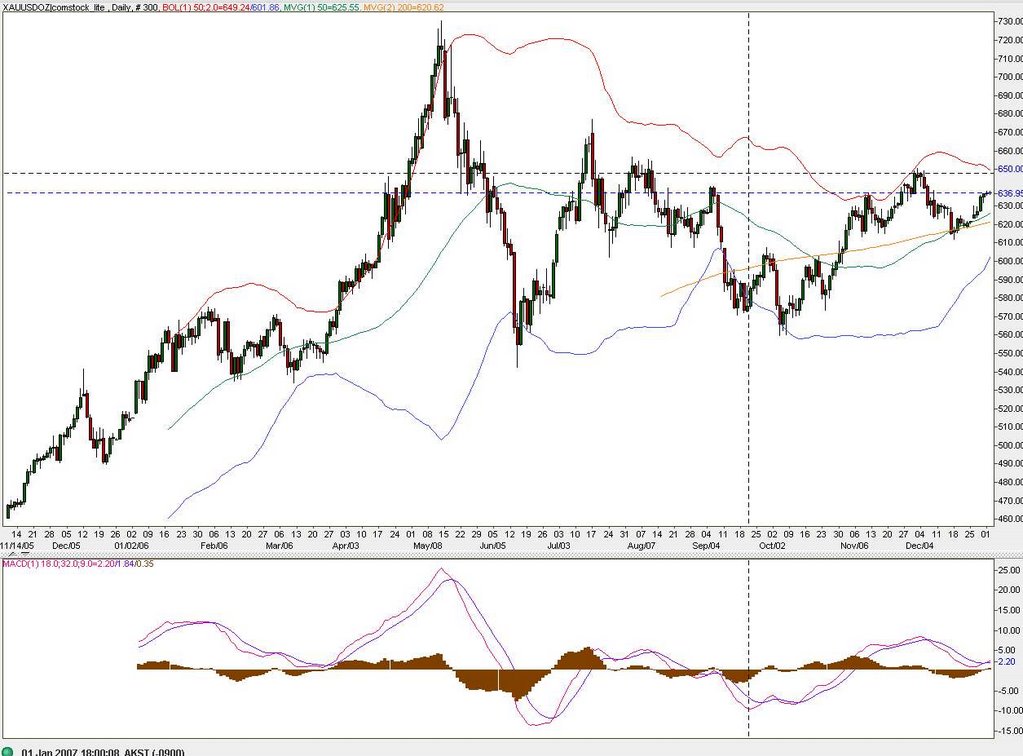
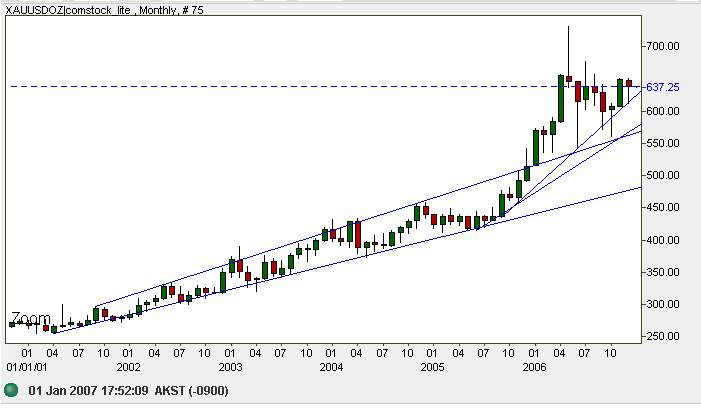
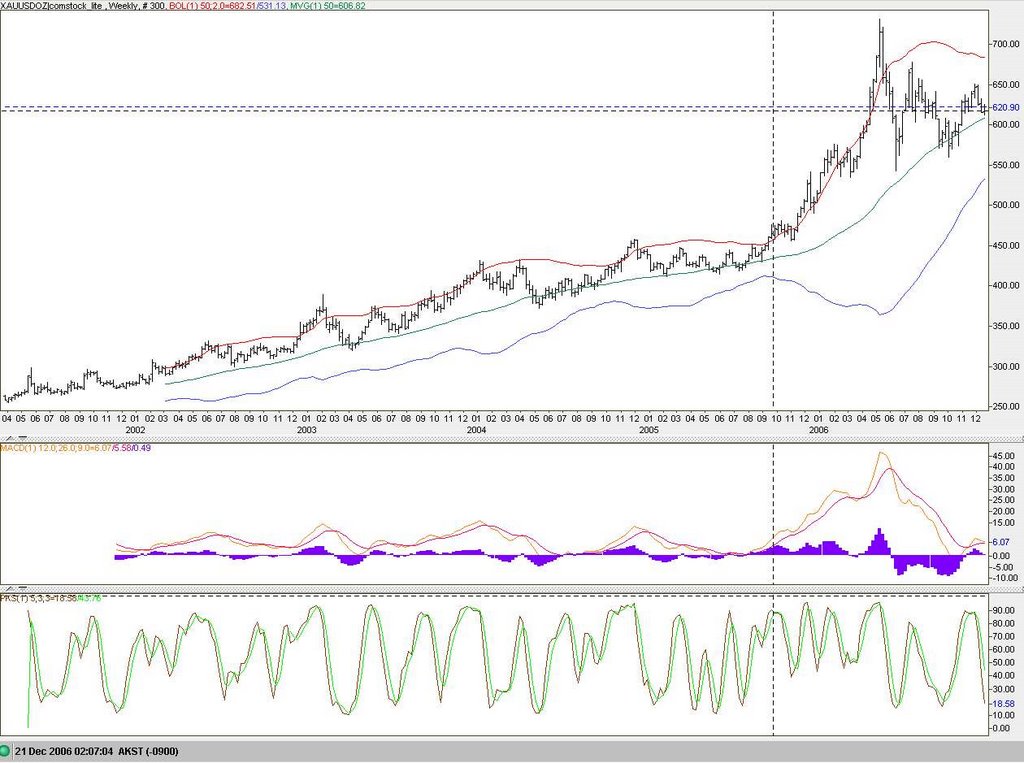
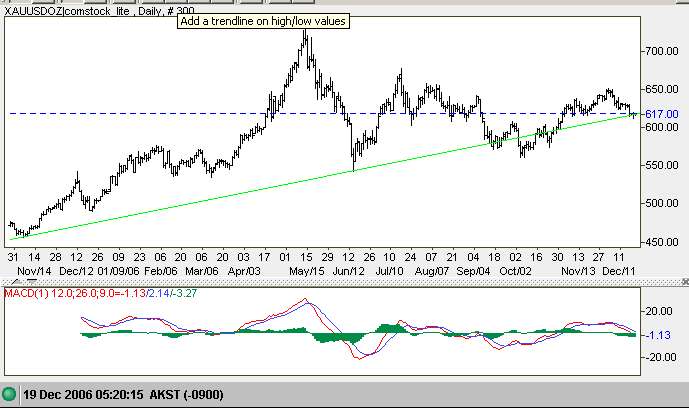
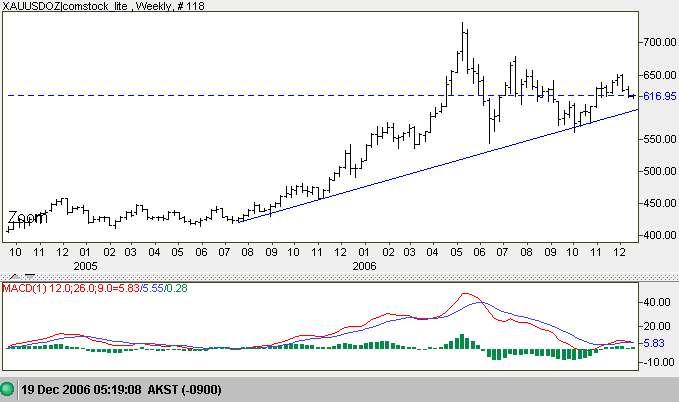
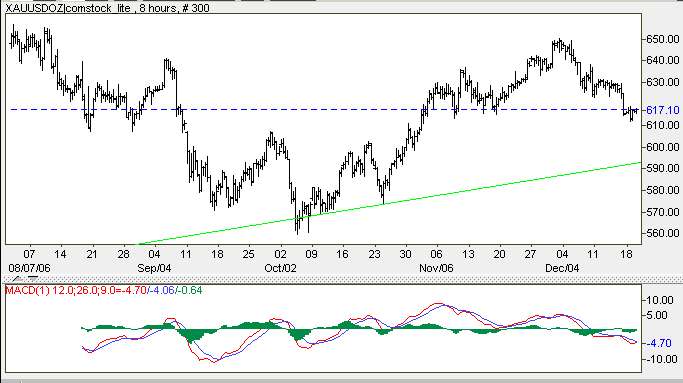
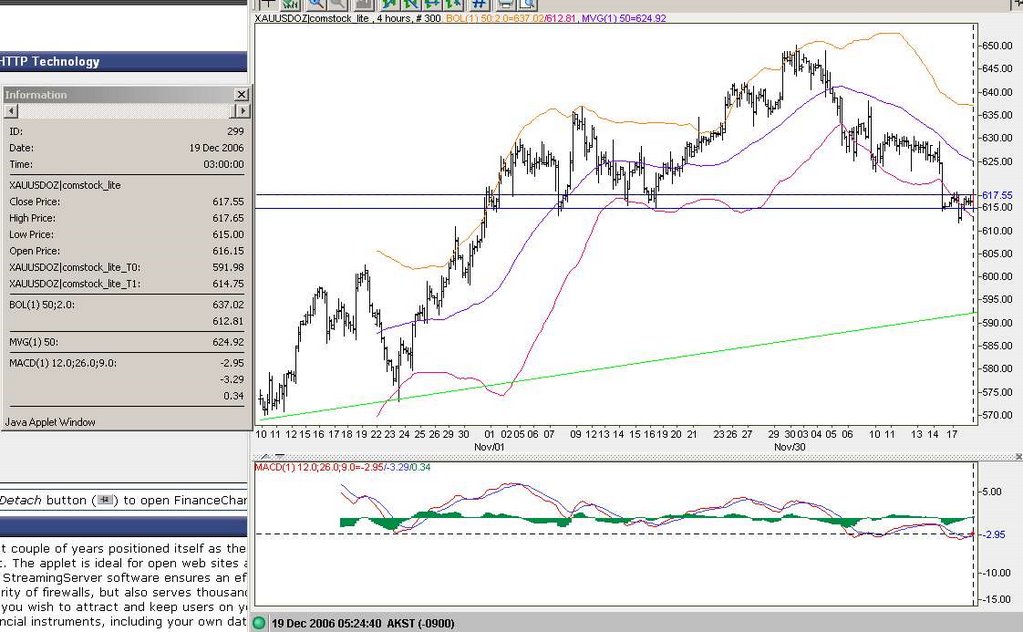
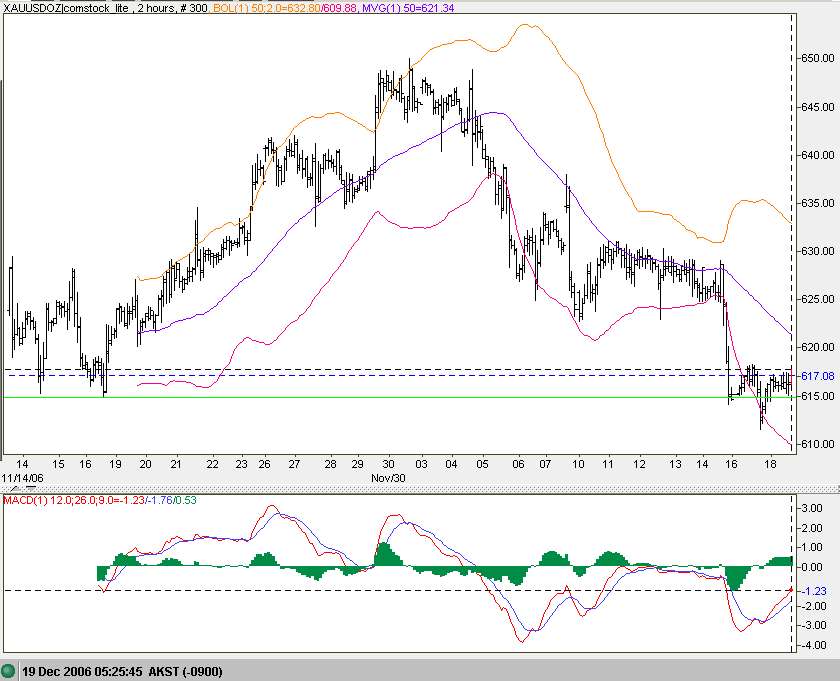
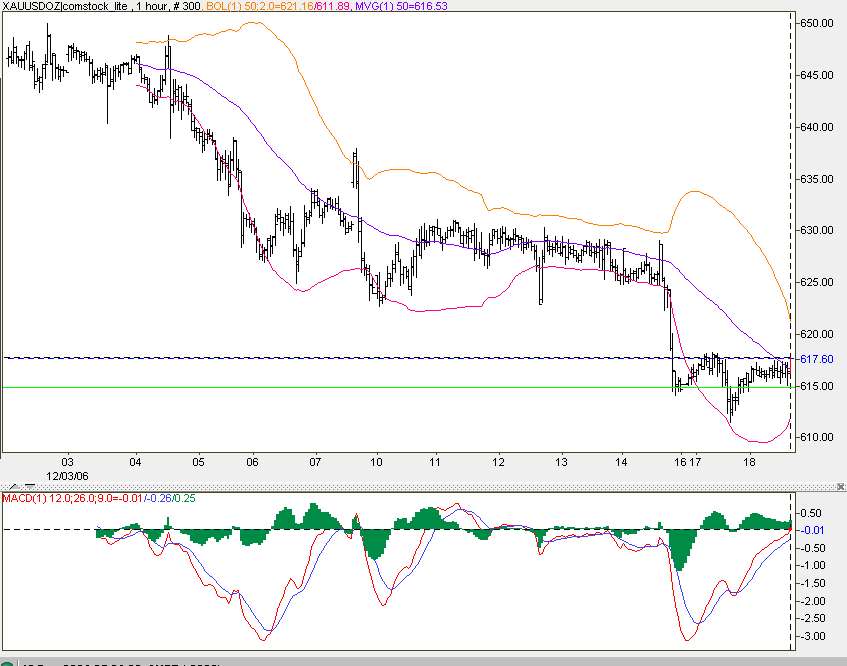
Here are a series of GOLD charts for your viewing pleasure. Note the time frames at the top as you review. I am calling this SMACK down OVER, BUY!! I hav been adding to positions throughout the past week, on today' reversal went long some MNG Calls on GG and more EGO dipping a bit into margin....

posted by Jim at 12/19/2006 11:07:00 AM
|
0 comments
![]()
![]()
As is the case in the gold market... breakouts are fake outs...
posted by Jim at 12/14/2006 12:31:00 PM
|
0 comments
![]()
![]()
Take a look at your gold stocks and I recommend ADDING.
posted by Jim at 12/01/2006 12:12:00 AM
|
0 comments
![]()
![]()

posted by Jim at 11/25/2006 04:33:00 PM
|
0 comments
![]()
![]()
posted by Jim at 11/25/2006 04:21:00 PM
|
0 comments
![]()
![]()
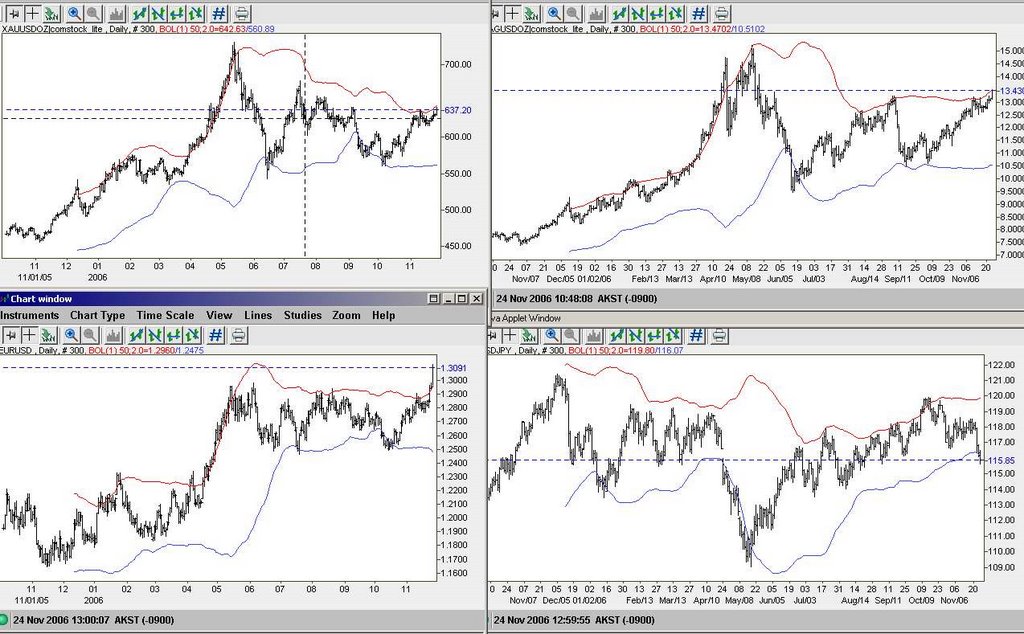
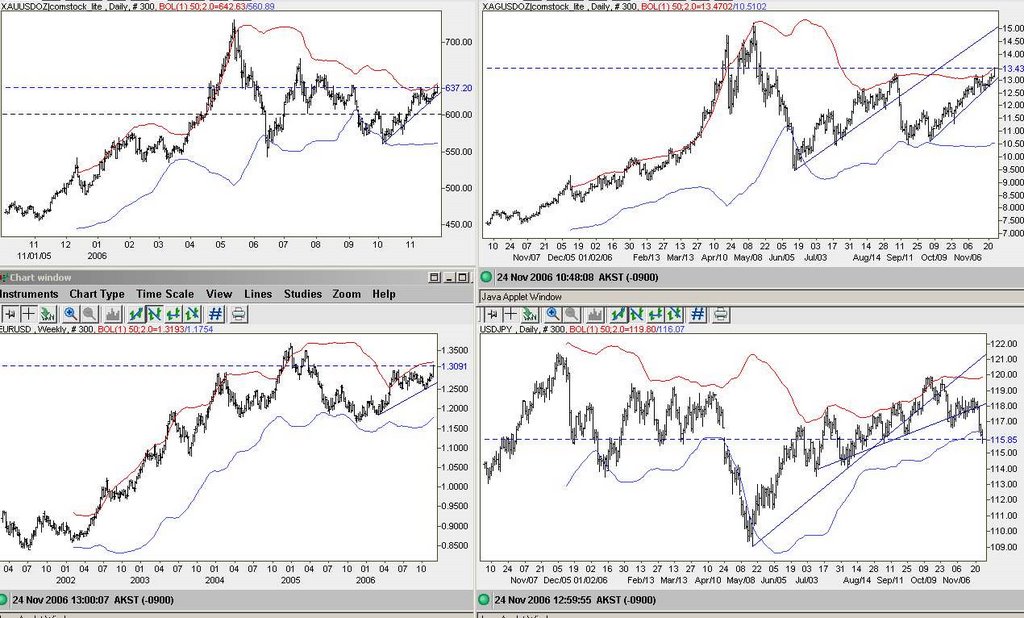
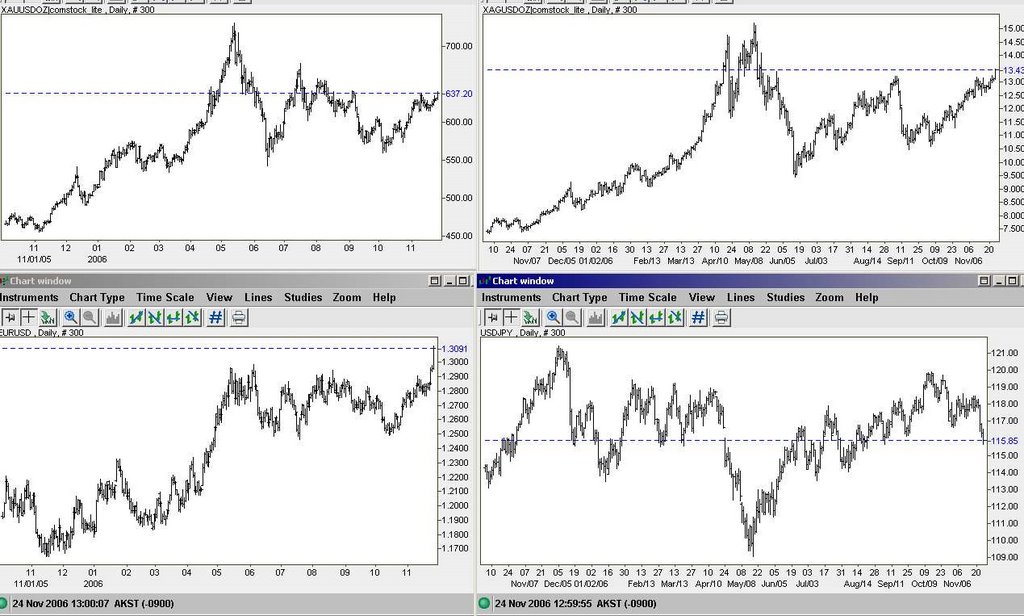
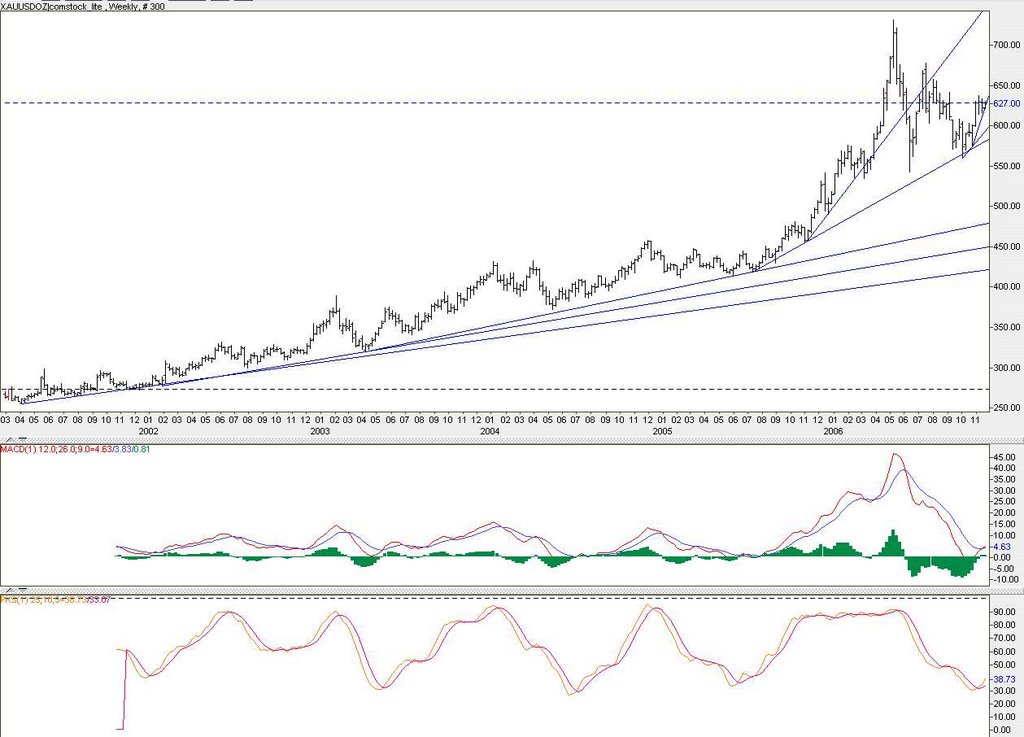
Here are a weekly and daily on gold your viewing pleasure. My read is the A B C legs in mining stocks are complete and we are headed to D targets and beyond.

posted by Jim at 11/22/2006 09:18:00 AM
|
0 comments
![]()
![]()

posted by Jim at 11/19/2006 02:13:00 AM
|
0 comments
![]()
![]()
Gold continues higher this evening (it's 9:20 pm Alaska time and 1:20 am in New York. Looking at thist chart notice the horizontal line (current price) is testing the horizontal support/resistance area. We have also crossed the 50 unit moving average heading for the upper bollenger band. In shorter timeframes the price is very sensitive to the BBand. For traders this can be very useful.
posted by Jim at 11/01/2006 01:18:00 AM
|
0 comments
![]()
![]()


posted by Jim at 10/30/2006 03:05:00 AM
|
0 comments
![]()
![]()
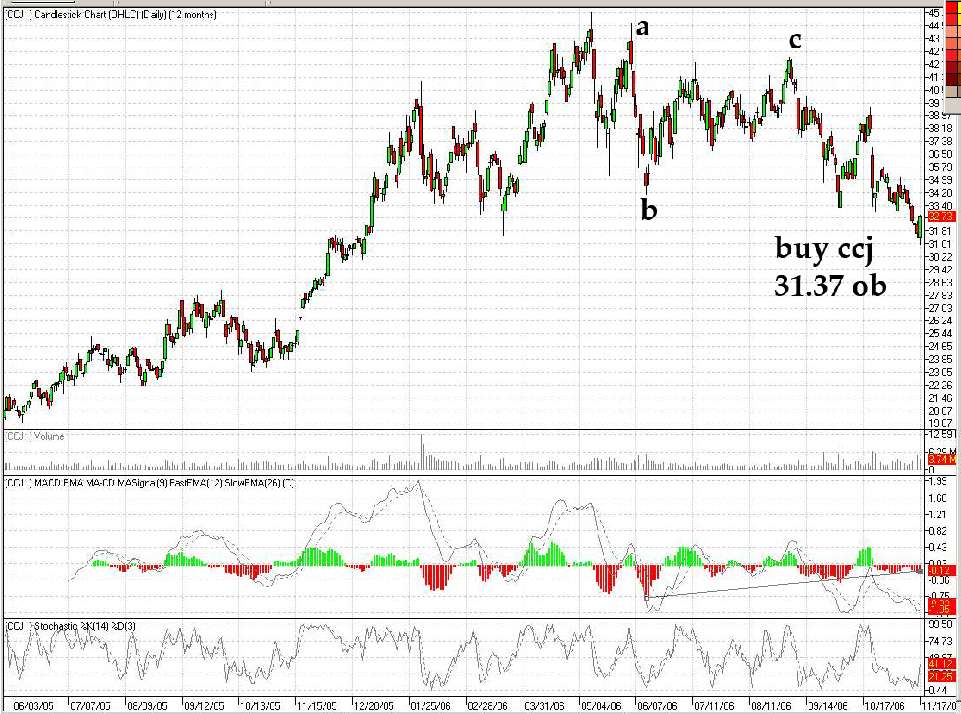
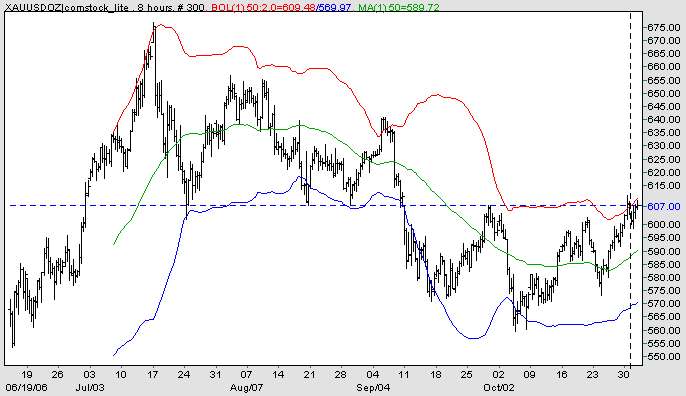
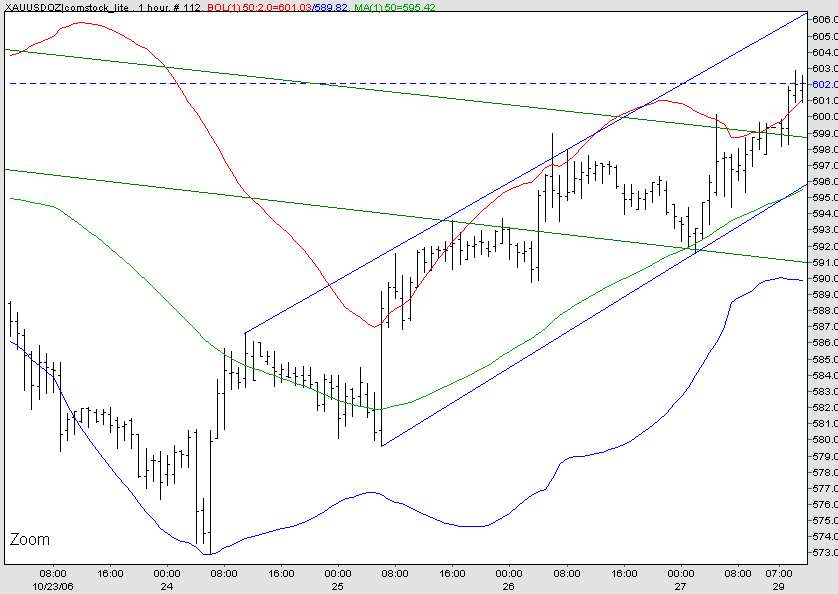
Wecome again, for those of you in Rick's room I am inviting you to post up your hidden pivot studies here. I believe you can do it youself or just send me a chart with your studies. This is a space for all of us to use. It also provides somewhat of a record of our work
 4 HOUR BAR - NOTICE THE REVERSAL OFF THE LOWER BBAND. I mentioned the low in GLD at 10am eastern today.
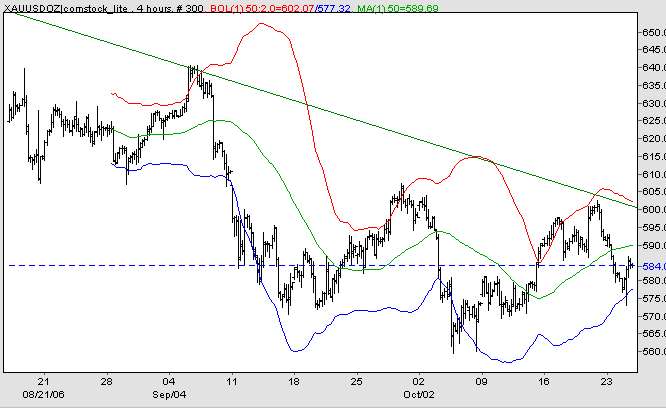 8 HOUR BAR, looking for a couple more zig zags and a nice H n S bottom, then off thru the trend-line with vigor... it'd be a nice outcome.
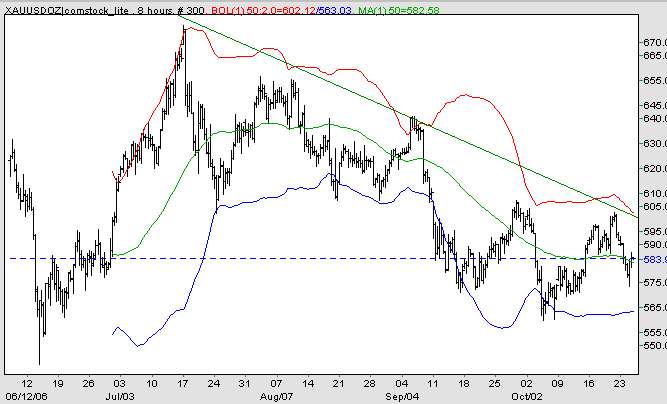 PAAS - One of my favorite stocks. you can study these pivots yourself. Nice and accurate.
posted by Jim at 10/24/2006 09:03:00 PM
|
0 comments
![]()
![]()


posted by Jim at 8/31/2006 07:53:00 PM
|
0 comments
![]()
![]()
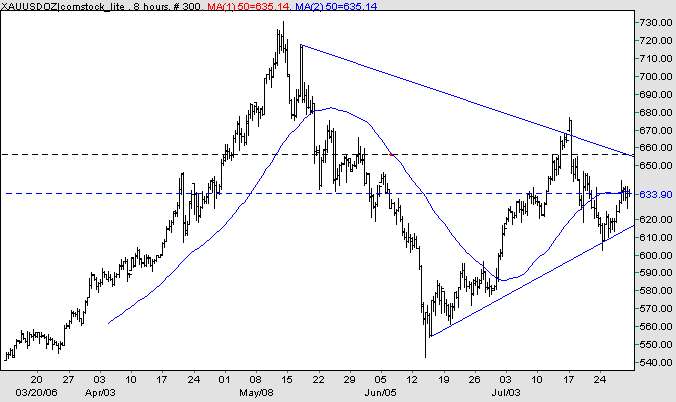
Gold has several hidden pivots in the 636 area where we sit right now and price is having trouble moving through this conjestion area. On the 8 hour bar there's resistance at the 50 unit MA. Longer term hidden pivots project a move back to 724.5 or on the down side to 566.5


posted by Jim at 7/30/2006 01:01:00 AM
|
0 comments
![]()
![]()

posted by Jim at 7/27/2006 03:47:00 AM
|
0 comments
![]()
![]()
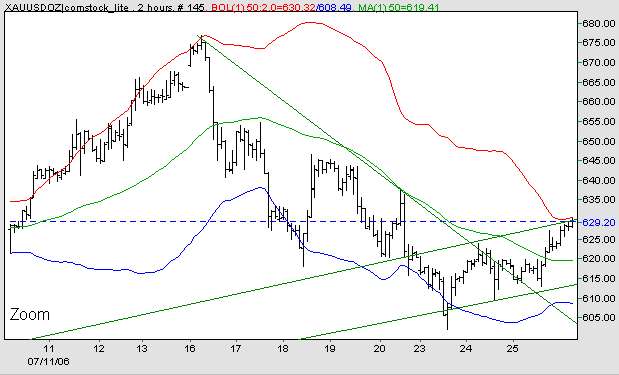
Here are a couple of charts illustrating the correction, or better put, "take down" of Gold. The first chart shows the trendline study and the second adds the BBands 50 unit with 50 unit on a 4 hour bar chart.
 These Gold charts and price projections are based on www.netdania.com gold feed.
posted by Jim at 7/19/2006 02:37:00 AM
|
0 comments
![]()
![]()


